Someone asked an interesting question on Facebook. Given the readings from a particulate matter sensor (PM10 and PM2.5), is there a way to “sanity check” the measurements? The question arose because the sensor sometimes provided negative values for the PM2.5 measurements. Was this miscalibration, a bad sensor or an error in the transmission system that left the rest of the data uncorrupted?
Someone who works on air pollution can certainly provide better answers to such a question but I think there might be something that can be deduced even with a minimum of subject knowledge. So treat the rest of this article with some scepticism. I just made this up on the spot.
Air pollution is not only local. Wind moves large quantities of air around in the atmosphere. Therefore, sensors are not only exposed to their hyperlocal conditions but also to the wider conditions i.e. on the scale of kilometres rather than meters.
There is a great citizen science project to measure air quality by Open Data Stuttard that provides the software and instructions to build your own particulate sensor. I built one for about £20. The results are then collected and also displayed on a map.
One the 9th of April, the pollution levels in Belgium were high as measured by these sensors.
 The key thing to note is that it is not just some sensors that measured high values but practically all sensors in Belgium. There is still variability between different sensors. I had a quick look and a sensor at a busy street had a higher reading than one in the middle of the countryside but the time-profile was nonetheless highly correlated. Newspaper reports confirm that pollution was high in Belgium.
Sadly, there are none of these sensors around Cambridge, where the sensor the asker was interested in is located.
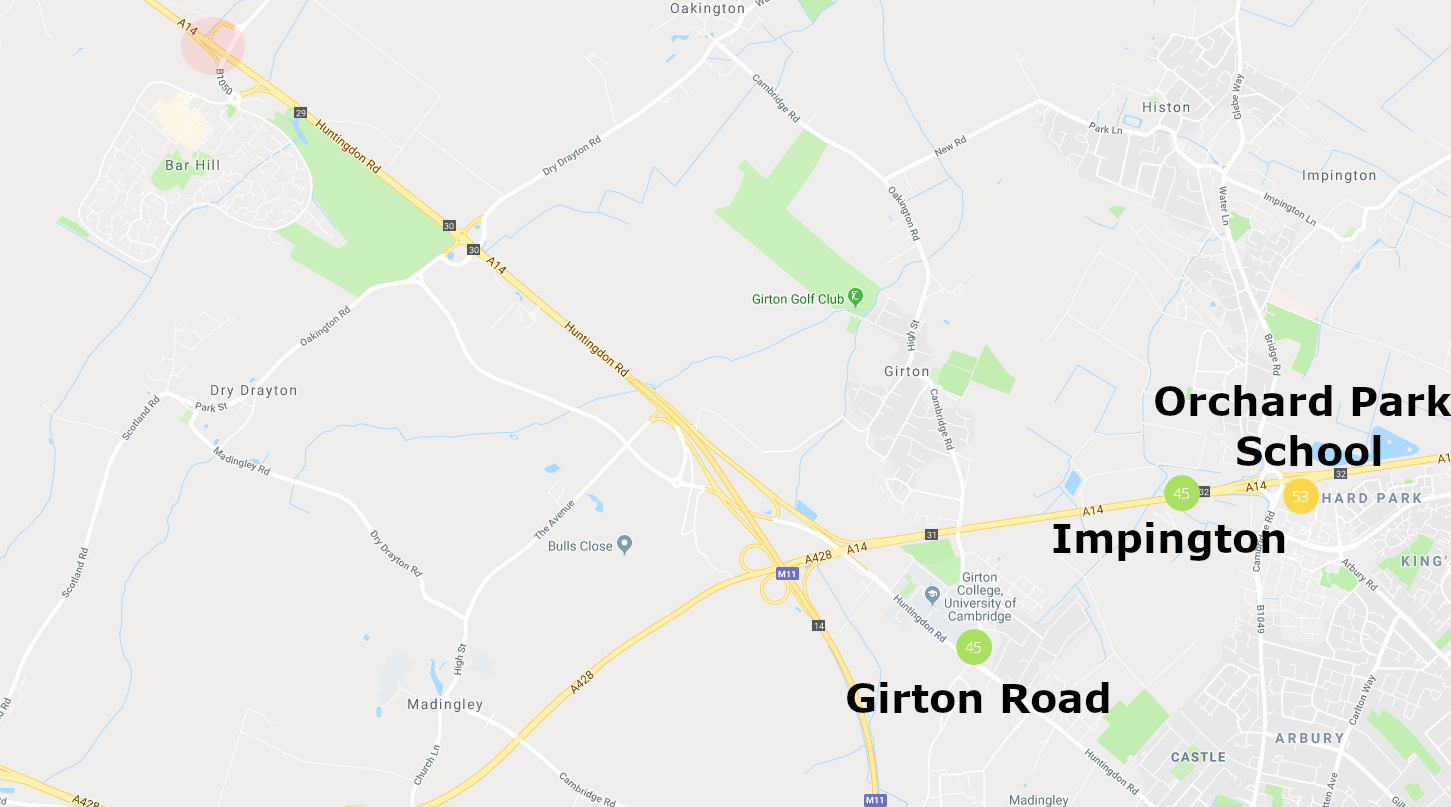
However, South Cambridgeshire Council has three measurments stations within 7 km of the sensor in question at Bar Hill. Let’s see if we can find a day where particulate matter concentration peaked at all three sensors. This would suggest that the measurement at the nearby sensor should also have peaked. We can then go check the data and use this as a basic sanity test. If the sensor did show a peak, it is measuring something.
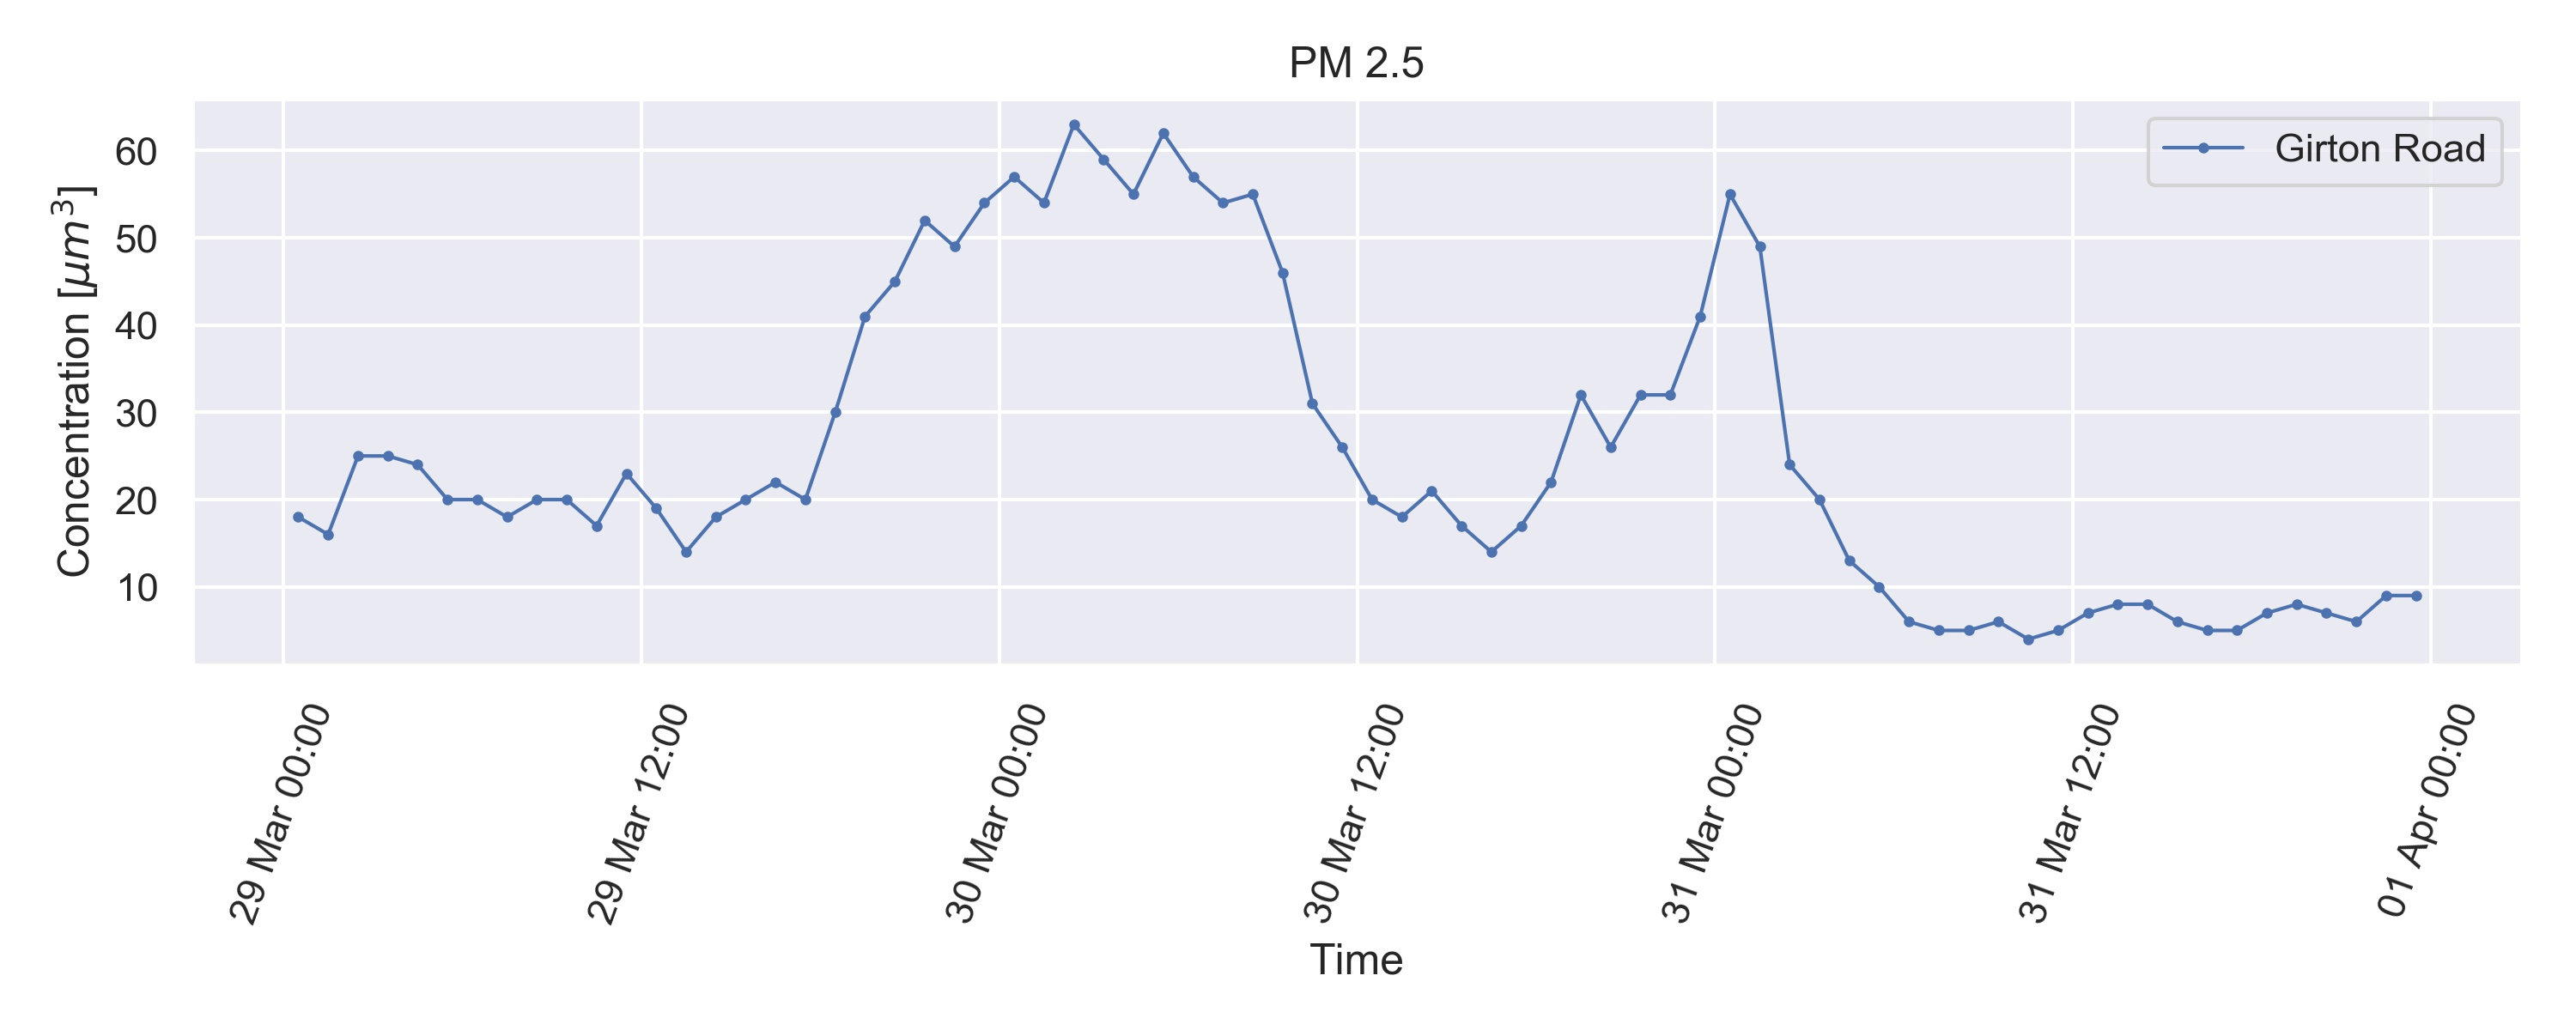
 Sadly, only one of the three, Girton Road, reports PM 2.5 for the last two month. As PM 10 and PM 2.5 are related measurements, a spike in PM 2.5 implies a spike in PM10, we can still get some mileage from our data.
Let’s have a quick look at the data:
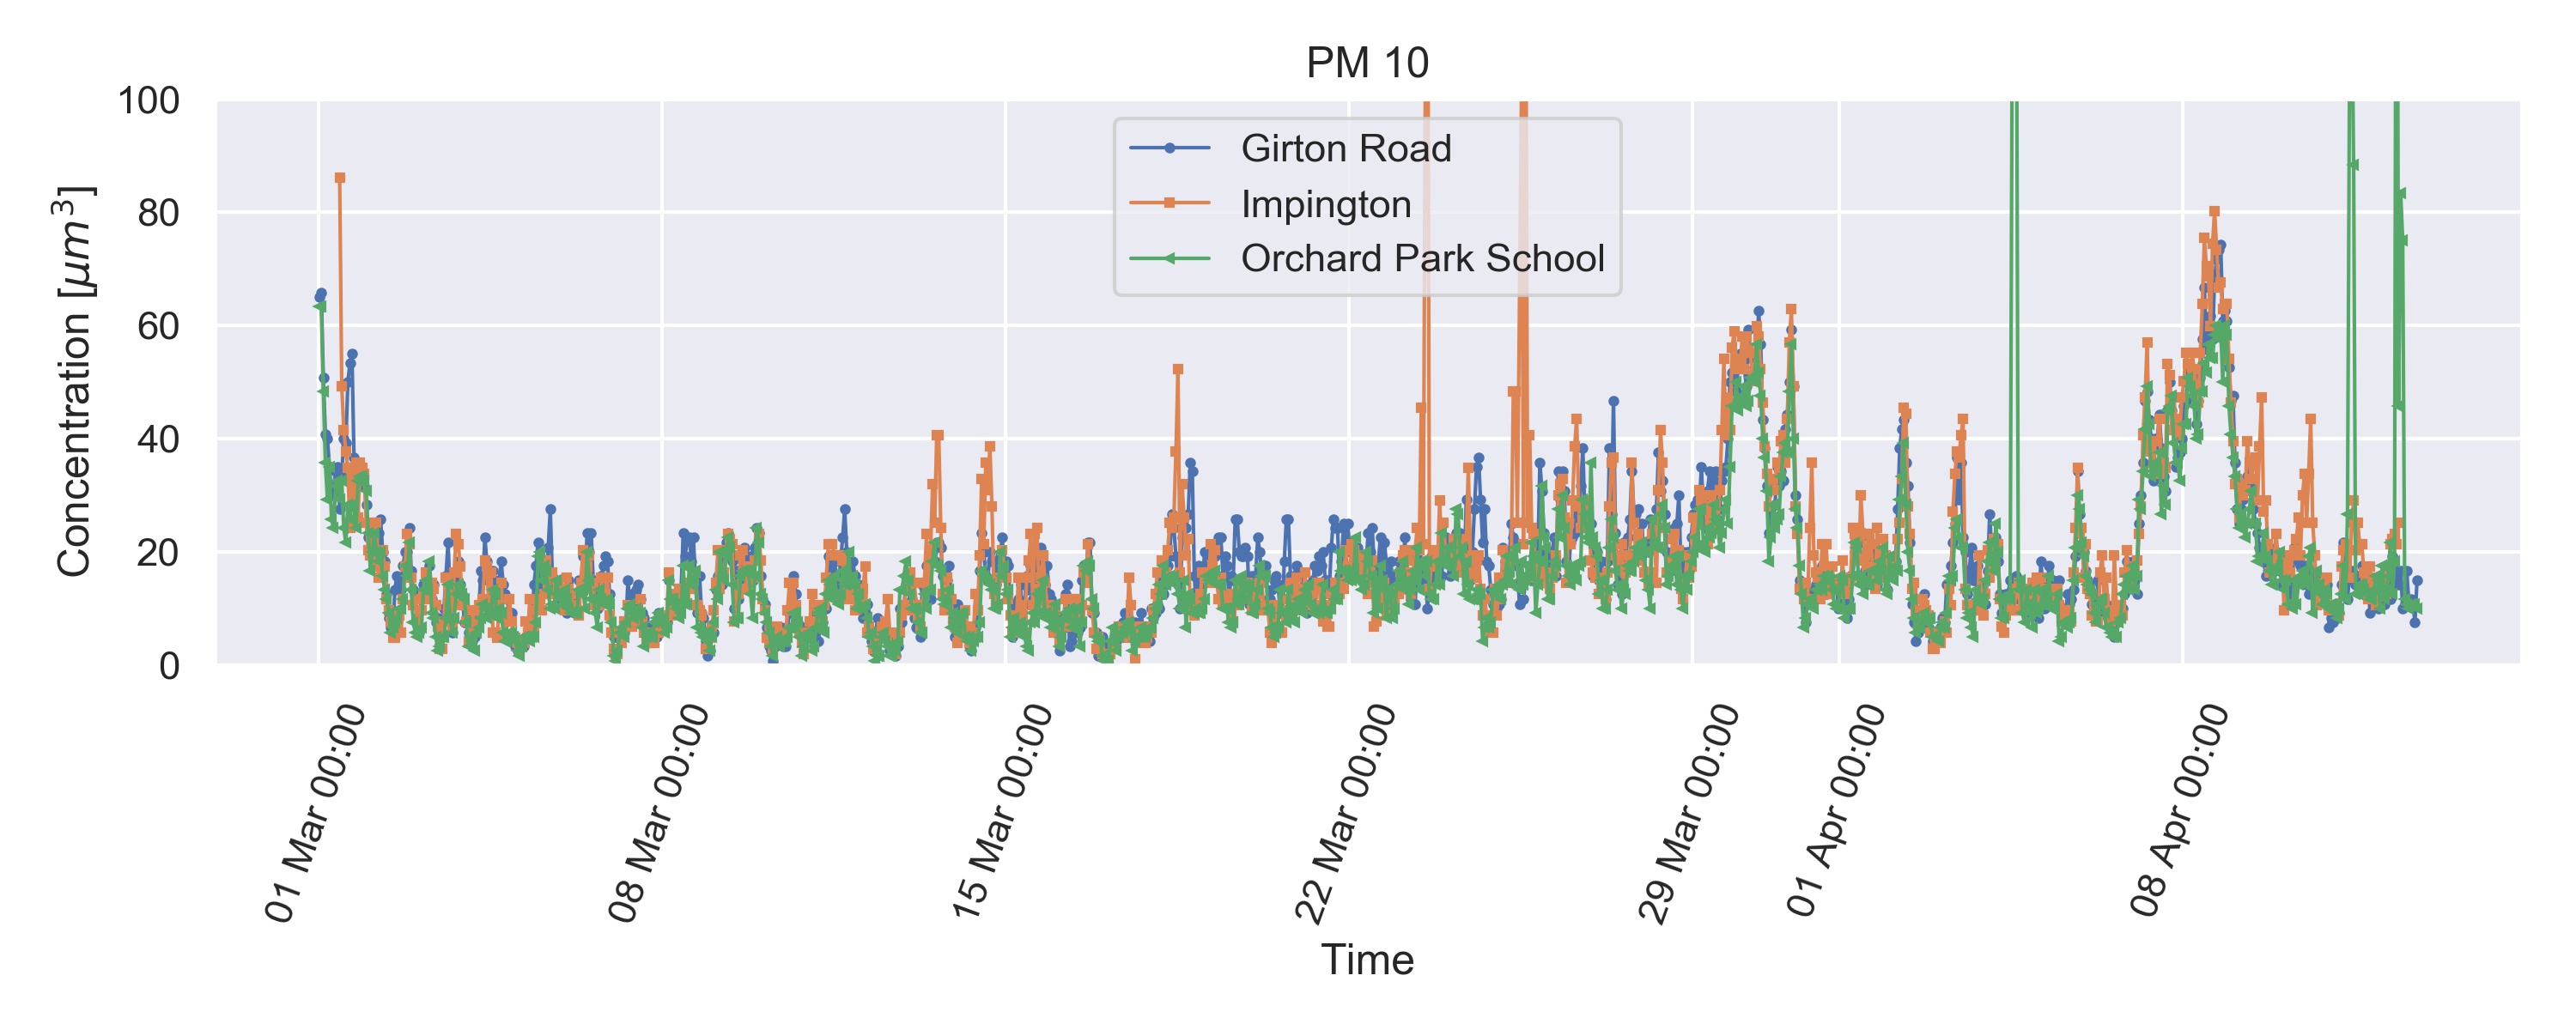
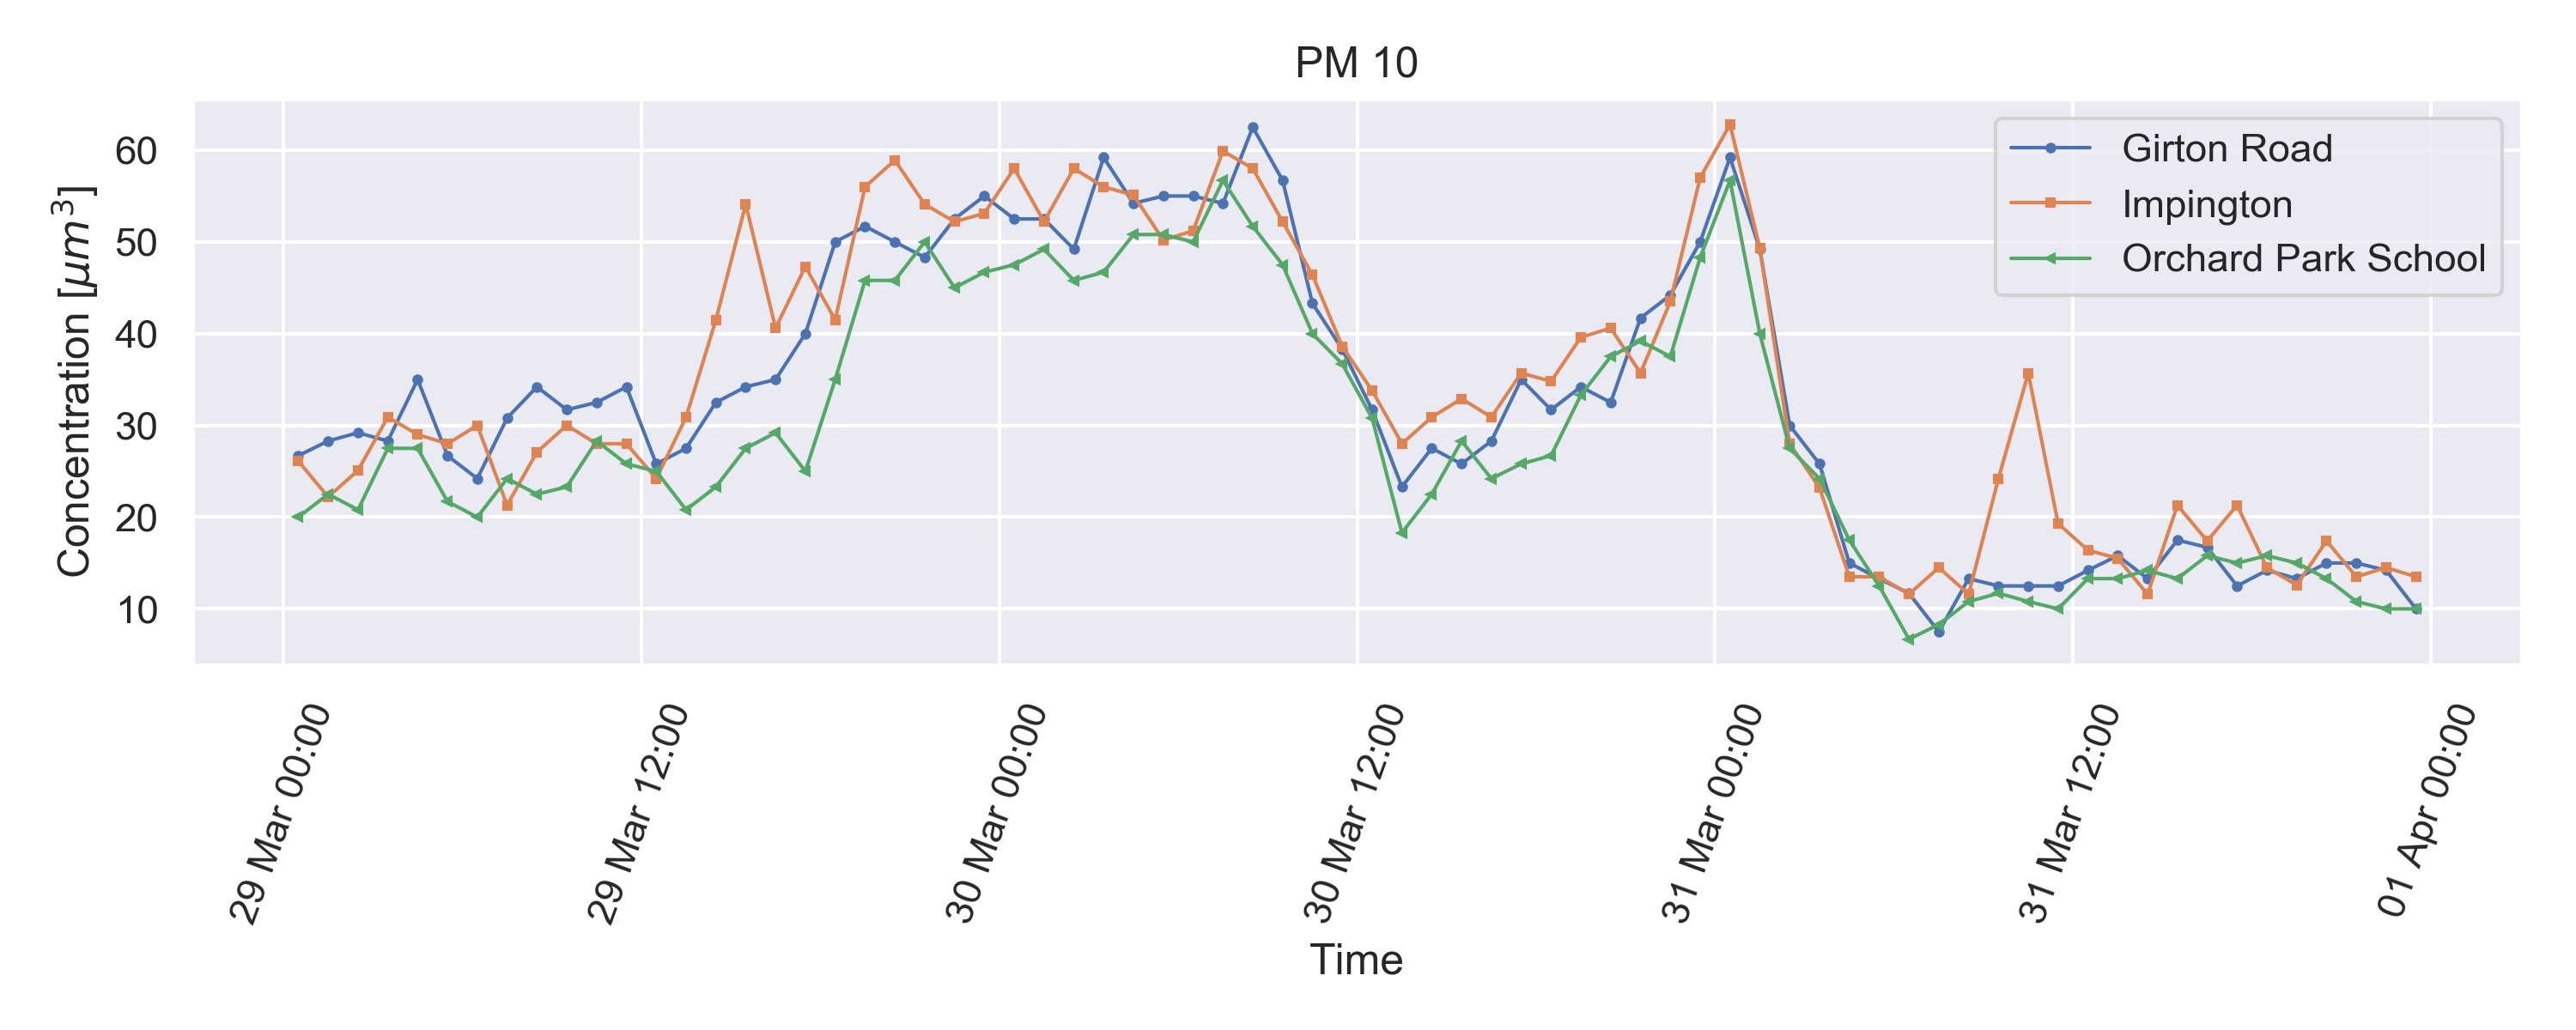
 The hypothesis that measurements in a region are correlated seems valid. Just after the 29th of March and on the 8th of April there is a spike in particulate concentration and all sensors are highly correlated. The same spike occurs for PM 2.5 concentration as well.
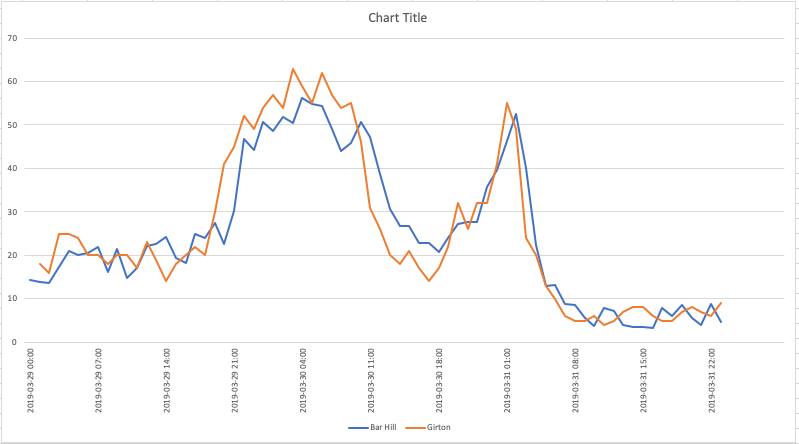
Let’s zoom in on those two spikes

 Caveats:
- these measurements stations are at most 4 km from each other and all of them are 6 -7 km from Bar Hill
- all measurement stations are within Cambridge while Bar Hill is outside (I would expect more pollution in build up areas)
That means that if there is no spike in the Bar Hill data, it does not prove that the sensor is malfunctioning. However, if there is a spike, then this gives us some confidence that the sensor is measuring something useful.
The code and data files used for generating the figures are here: cambridge-air-quality
Update: the measurements at Bar Hill do indeed track these peaks! So the sensor might be badly calibrated but still giving us some information about PM 2.5 concentration.